Building matrices from longform travel data
Source:vignettes/V2_build_matrices.Rmd
V2_build_matrices.RmdOnce the travel data has been converted the to generalized travel data format in the travel_data_template() and travel_data_sim() objects, utility functions can be used to build the data matrices required for fitting and simulating mobility models. For fitting these models the data must be converted into data matrices representing travel among locations (\(M\)), along with distances between locations (\(D\)) and population sizes of the origins and destinations (\(N\)).
Unique IDs
The first step is to add unique IDs to the travel data. If the data have all unique names at the lowest admin level then hierarchical IDs are not needed. However, if the data include repeated admin names, then higher admin levels must be included to make unique IDs.
travel_data <- travel_data_sim

# Add unique identifiers using Country, State, and County
example_ids <- get_unique_ids(travel_data, adm_start=0, adm_stop=2)
head(example_ids)
#>   orig_id dest_id
#> 1   A_B_O   A_B_G
#> 2   A_B_S   A_B_U
#> 3   A_B_N   A_B_L
#> 4   A_B_C   A_B_O
#> 5   A_B_R   A_B_M
#> 6   A_B_V   A_B_G

# Assume all County names here are unique, we can use only County level as ID.
example_ids <- get_unique_ids(travel_data, adm_start=2)
head(example_ids)
#>   orig_id dest_id
#> 1       O       G
#> 2       S       U
#> 3       N       L
#> 4       C       O
#> 5       R       M
#> 6       V       G
Build mobility matrix
# Add unique identifiers using County
travel_data <- cbind(travel_data, get_unique_ids(travel_data, adm_start=2))

# Build mobility matrix from the longform data
M <- get_mob_matrix(orig=travel_data$orig_id,
                    dest=travel_data$dest_id,
                    value=travel_data$trips)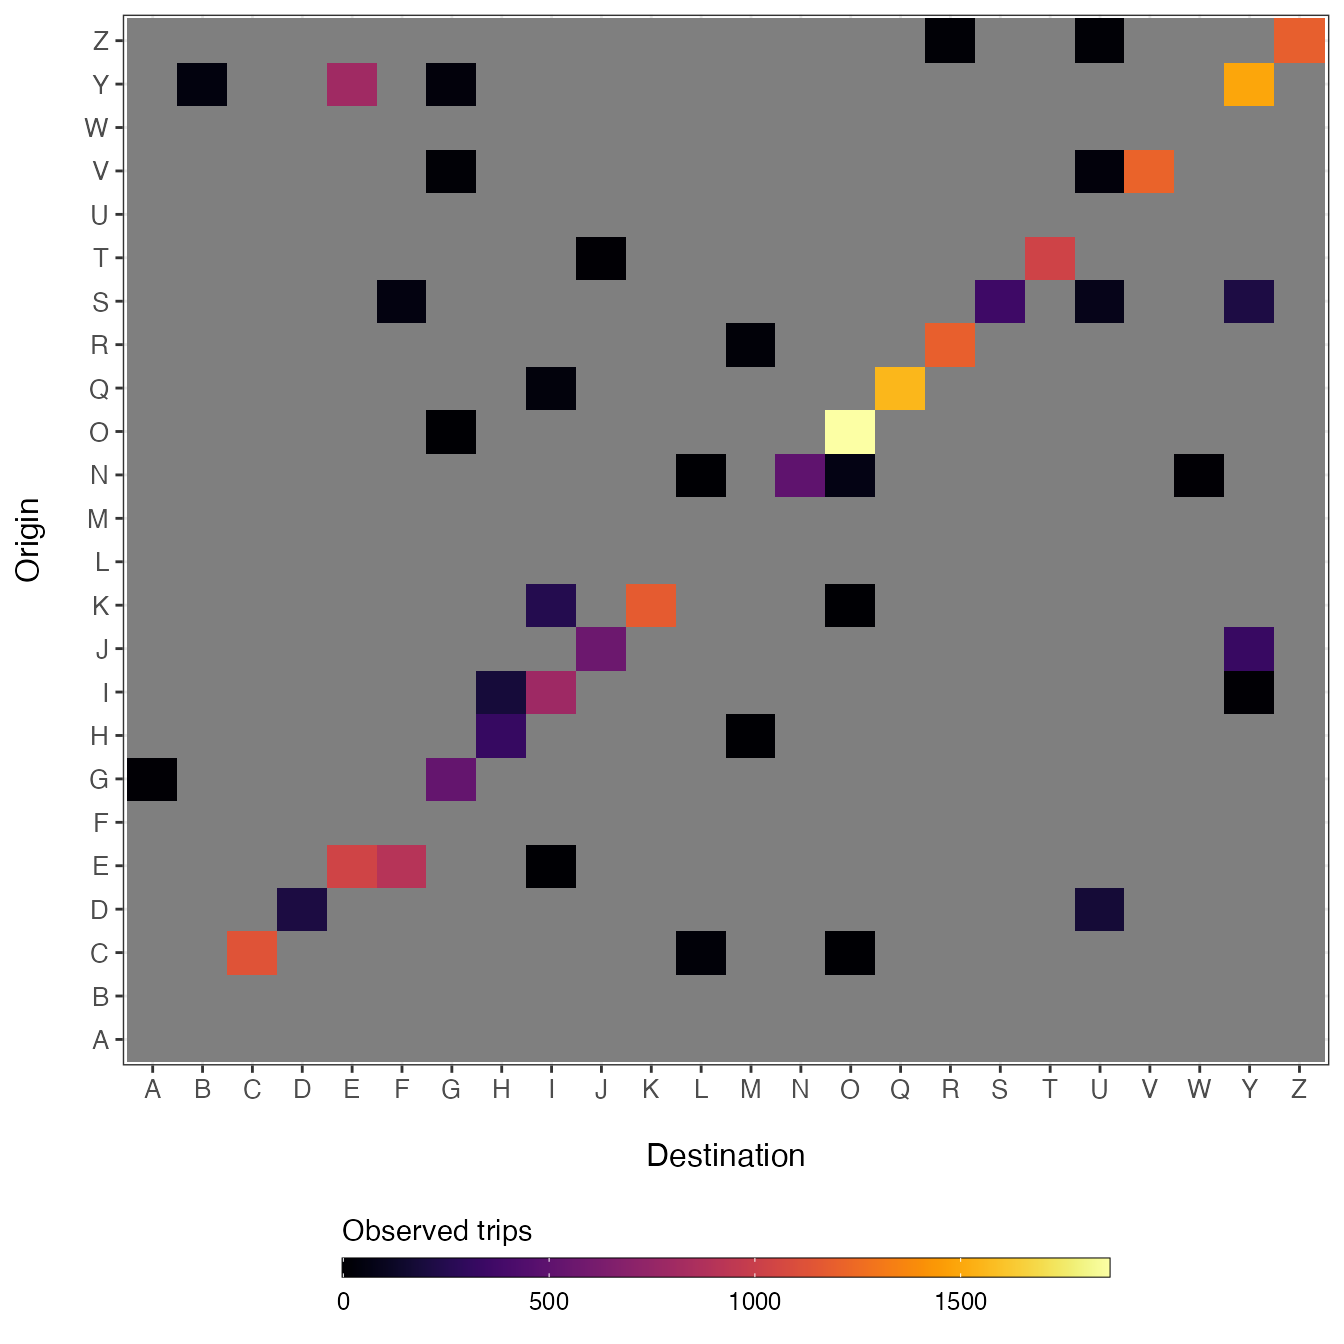
Many times there are missing observations in travel data. This is especially the case when the travel data span a short time period which increase the likelihood that travel along some routes will not be observed. It can be difficult to see these missing routes of travel in longform data, but when you make a matrix with each row \(i\) representing and origin and each column \(j\) representing a destination, the missing data are readily apparent (shown as grey cells in the simulated matrix above).
Build distance matrix
Mobility models require that distances be provided for all routes even if these observations are missing in the mobility matrix (\(M\)). A distance matrix for all unique routes can be built by getting all unique coordinates in the travel data using the get_unique_coords() function and then calculating the distances among all locations with get_distance_matrix(). Note that there is no requirement for the units of the distance matrix. However, we recommend the scale used is sensible for the spatial scale of the study area.
xy <- get_unique_coords(travel_data)

D <- get_distance_matrix(x=xy[,1],
                         y=xy[,2],
                         id=xy[,3])

D <- D*111.35 # decimal degrees to km
D[1:5, 1:5]
#>       destination
#> origin        A         B         C        D         E
#>      A   0.0000 236.22609 151.06324 493.0824 139.02433
#>      B 236.2261   0.00000  85.84357 346.2563  99.05488
#>      C 151.0632  85.84357   0.00000 396.3398  26.41282
#>      D 493.0824 346.25626 396.33982   0.0000 385.29829
#>      E 139.0243  99.05488  26.41282 385.2983   0.00000
Population size vector
Fitting mobility modelsalso require a vector of population size for each location that is the same length the number of rows and columns in the mobility matrix (\(M\)) and distance matrix (\(D\)).
N <- get_pop_vec(travel_data)
head(N)
#>    A    B    C    D    E    F
#> 5065 8179 3961 5540 1337 5776
Note that since the distance matrix (\(N\)) and population vector (\(N\)) are covariates used by models, they cannot have missing values and must all have matching dimensions. Code below checks that all data dimensions match.